Peth
An Android Application similar to Instagram
This website will present my portfolio (projects), mainly from my work experience and college projects. I have completed more than a dozen projects until now, so I will showcase some of them and tell a bit about what did I learn from it.
An Android Application similar to Instagram
Website Design of an Art Auction Website.
A Role-Playing Game Programmed in C Language.
Database Query Simulation Project.
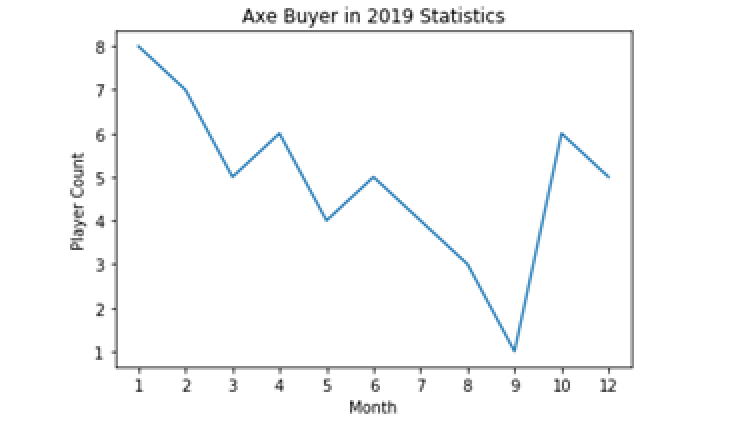
Query and Data Visualization Final Test.
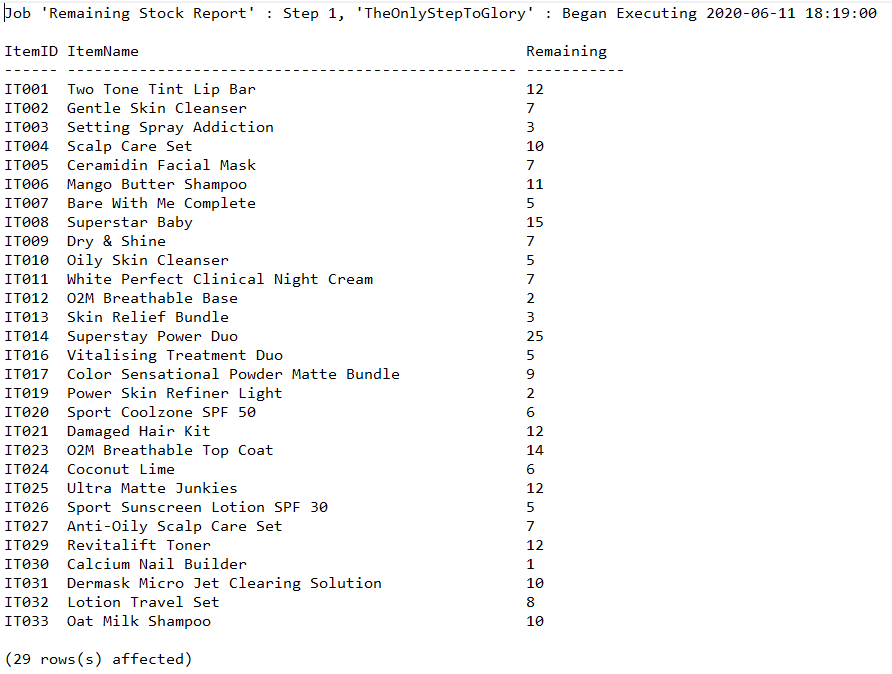
Database Administration Final Test.
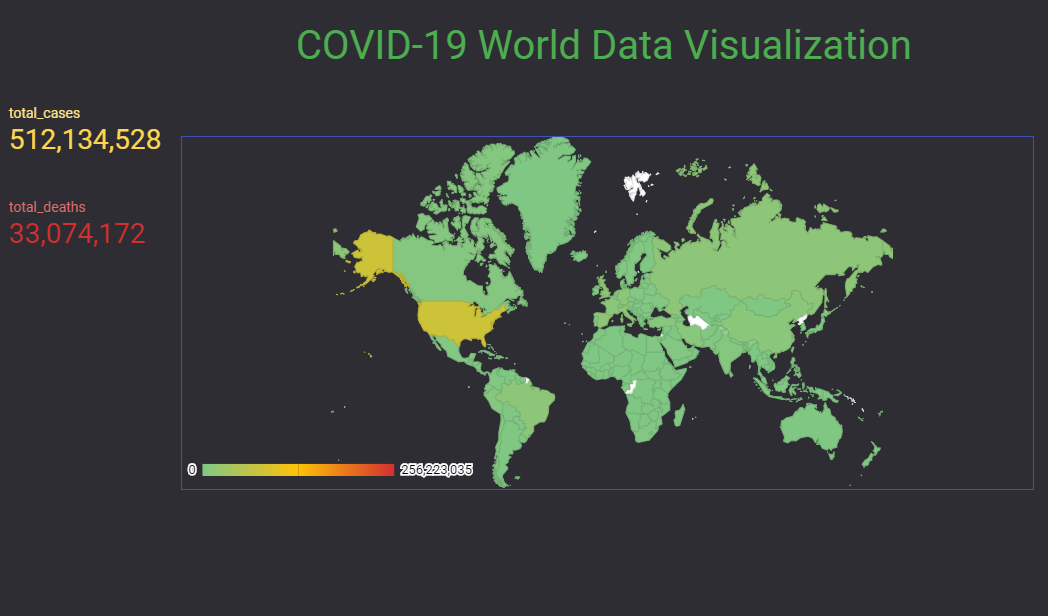
COVID-19 Data Visualization.
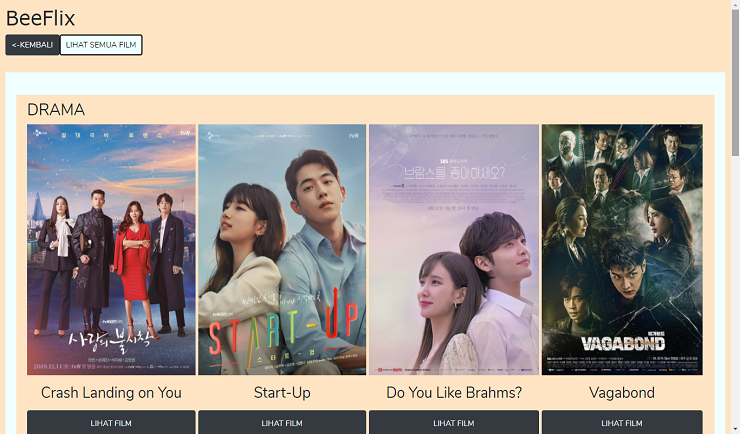
A Dynamic Website of Movies.
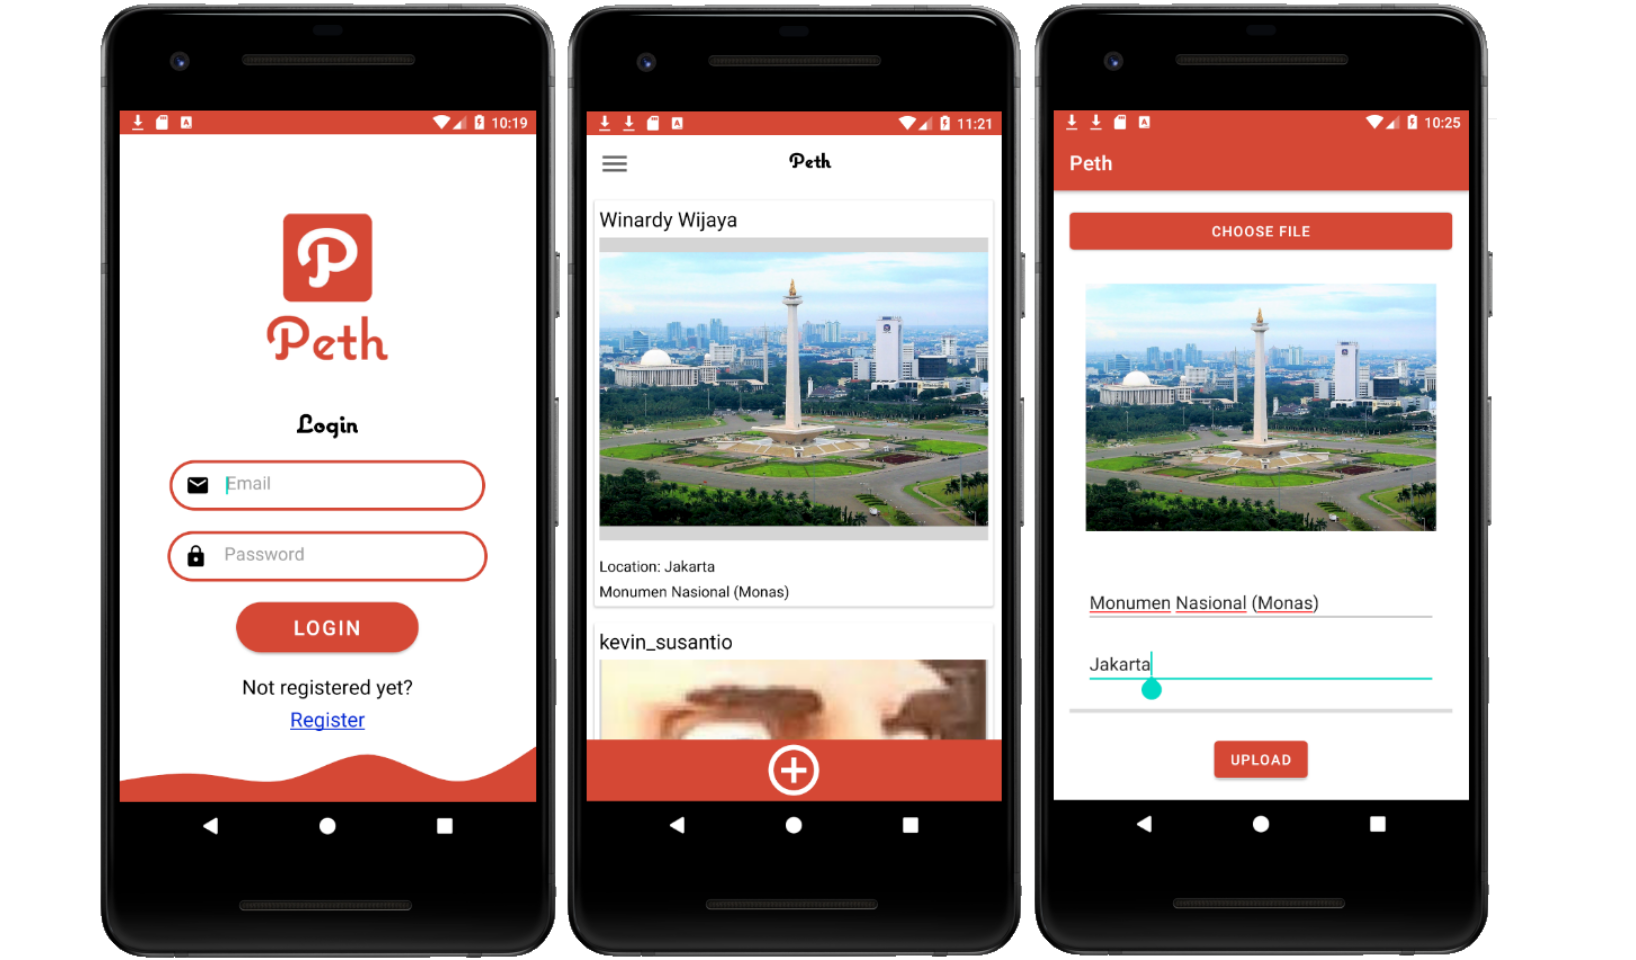
As an end term project for Mobile Programming course in the 5th semester, Axel Tanuwinata, Georgius Jovan, Winardy Wijaya, Kadek Agus Pradnya Bayu Putra, Nathan Oktavian Engolodoe and I developed an android application for social networking-enabled photo sharing service. This app is similar to other photo sharing apps such as Instagram.
In this project, I learnt about Firebase Realtime Database, login system, uploading photo and Google Maps API in android. I'm the one who implemented the Firebase, photo upload, and the login system in the app.
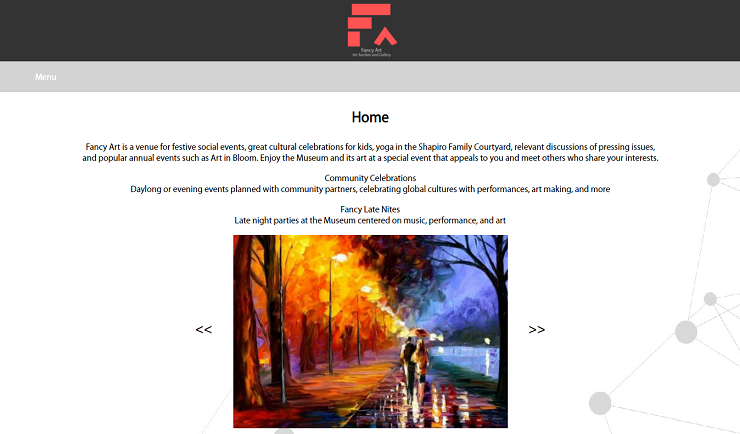
As an end term project for Human Computer Interaction course in the 4th semester my team, Christian Raymond Wijaya, Winardy Wijaya, Fahrain, and I developed a website design for an art auction. The website name is Fancy Art, it shows information about ongoing and oncoming auction, and the art gallery.
Code available upon request.
This Human Computer Interaction course is laboratory based, so we mostly did practicum. We learnt how to make an interactive website using HTML, CSS, and JavaScript. After the course finished, I felt very proud of myself that I can already design an average interactive website.
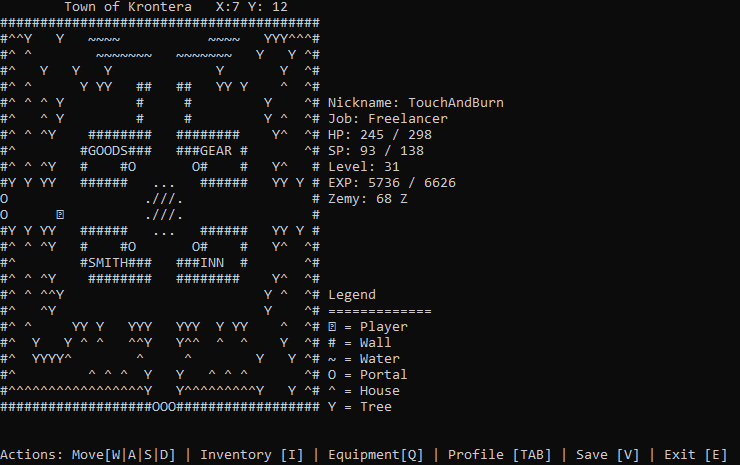
As a mandatory project for Laboratory Center Alam Sutera (LCAS) assistant pre-training, I developed a role-playing game programmed in C language. The game includes: leveling up, fighting monsters, and map exploration.
Code available upon request.
I signed up myself to become LCAS lab assistant back in October 2019. I had a mandatory project to create a role-playing game in C language that must be completed in 1 month. The instructor gave the trainees an .exe file which was the game (without the code). So we needed to re-create the game using C language from scratch. The logic wasn't that hard, in fact the hardest or trickiest part was to make sure that every validation is correctly made.
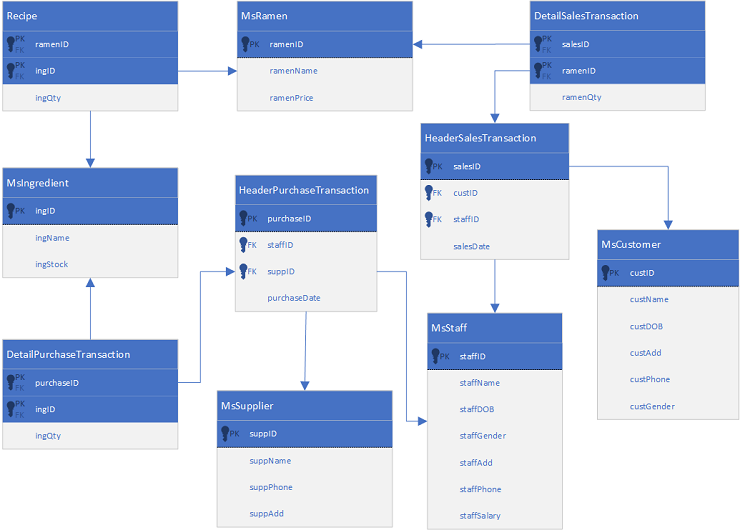
As an end term project for Database Systems in the 3rd semester my team, Jacelyn Angraini, Jesslyn Callista, and I developed a Ramen Shop database system (dummy data). We created an ERD and queries to complete the final project.
Code available upon request.
The Database Systems course was mainly focused on DDL and DML commands. We only learnt a little about DCL and creating view. Although I personally learnt it from the internet. After this course, I realized that I'm into database.
As an end term test for Big Data course in the 4th semester, I had 3 cases, the first case I needed to create some queries and a visualization using pySpark (SparkSQL).
Code available upon request.
Big Data course was mainly focused on data visualization, classification, and clustering (including model testing and evaluation). Data visualization is a powerful representation of data that can lead to better decision making.
As an end term test for Database Administration in the 4th semester, I needed to create some queries to answer 10 questions mainly to display some transaction processes.
Code available upon request.
Database Administration course was mainly focused on the role of a DB Admin, to do transaction management, optimizing SQL server, and query processing. After this course, it turned out that a DB admin has a really important role in maintaining a database system.
As an assignment for Big Data course in the 4th semester my team, Axel Tanuwinata, Fahrain, Nelson Tanzil, Winardy Wijaya, and I needed to create a COVID-19 data visualization.
This assignment was from lecture class, we needed to create a COVID-19 data visualization using any visualization software. Google Data Studio was very easy to use and very intuitive. We just need to download the COVID-19 data source from the internet (example: github) and upload it to the Google Data Studio. After that, we can use the tools provided in Google Data Studio.
As an mid-term test for Web Programming course in the 5th semester I needed to create a movie website which shows detail of each movie/tvshow and how many episode it has.
Code available upon request.
Laravel is a powerful framework to create a dynamic website. I learnt a lot to connect back-end to front-end from this course.